ANALYSIS – Ontario’s Urban Election
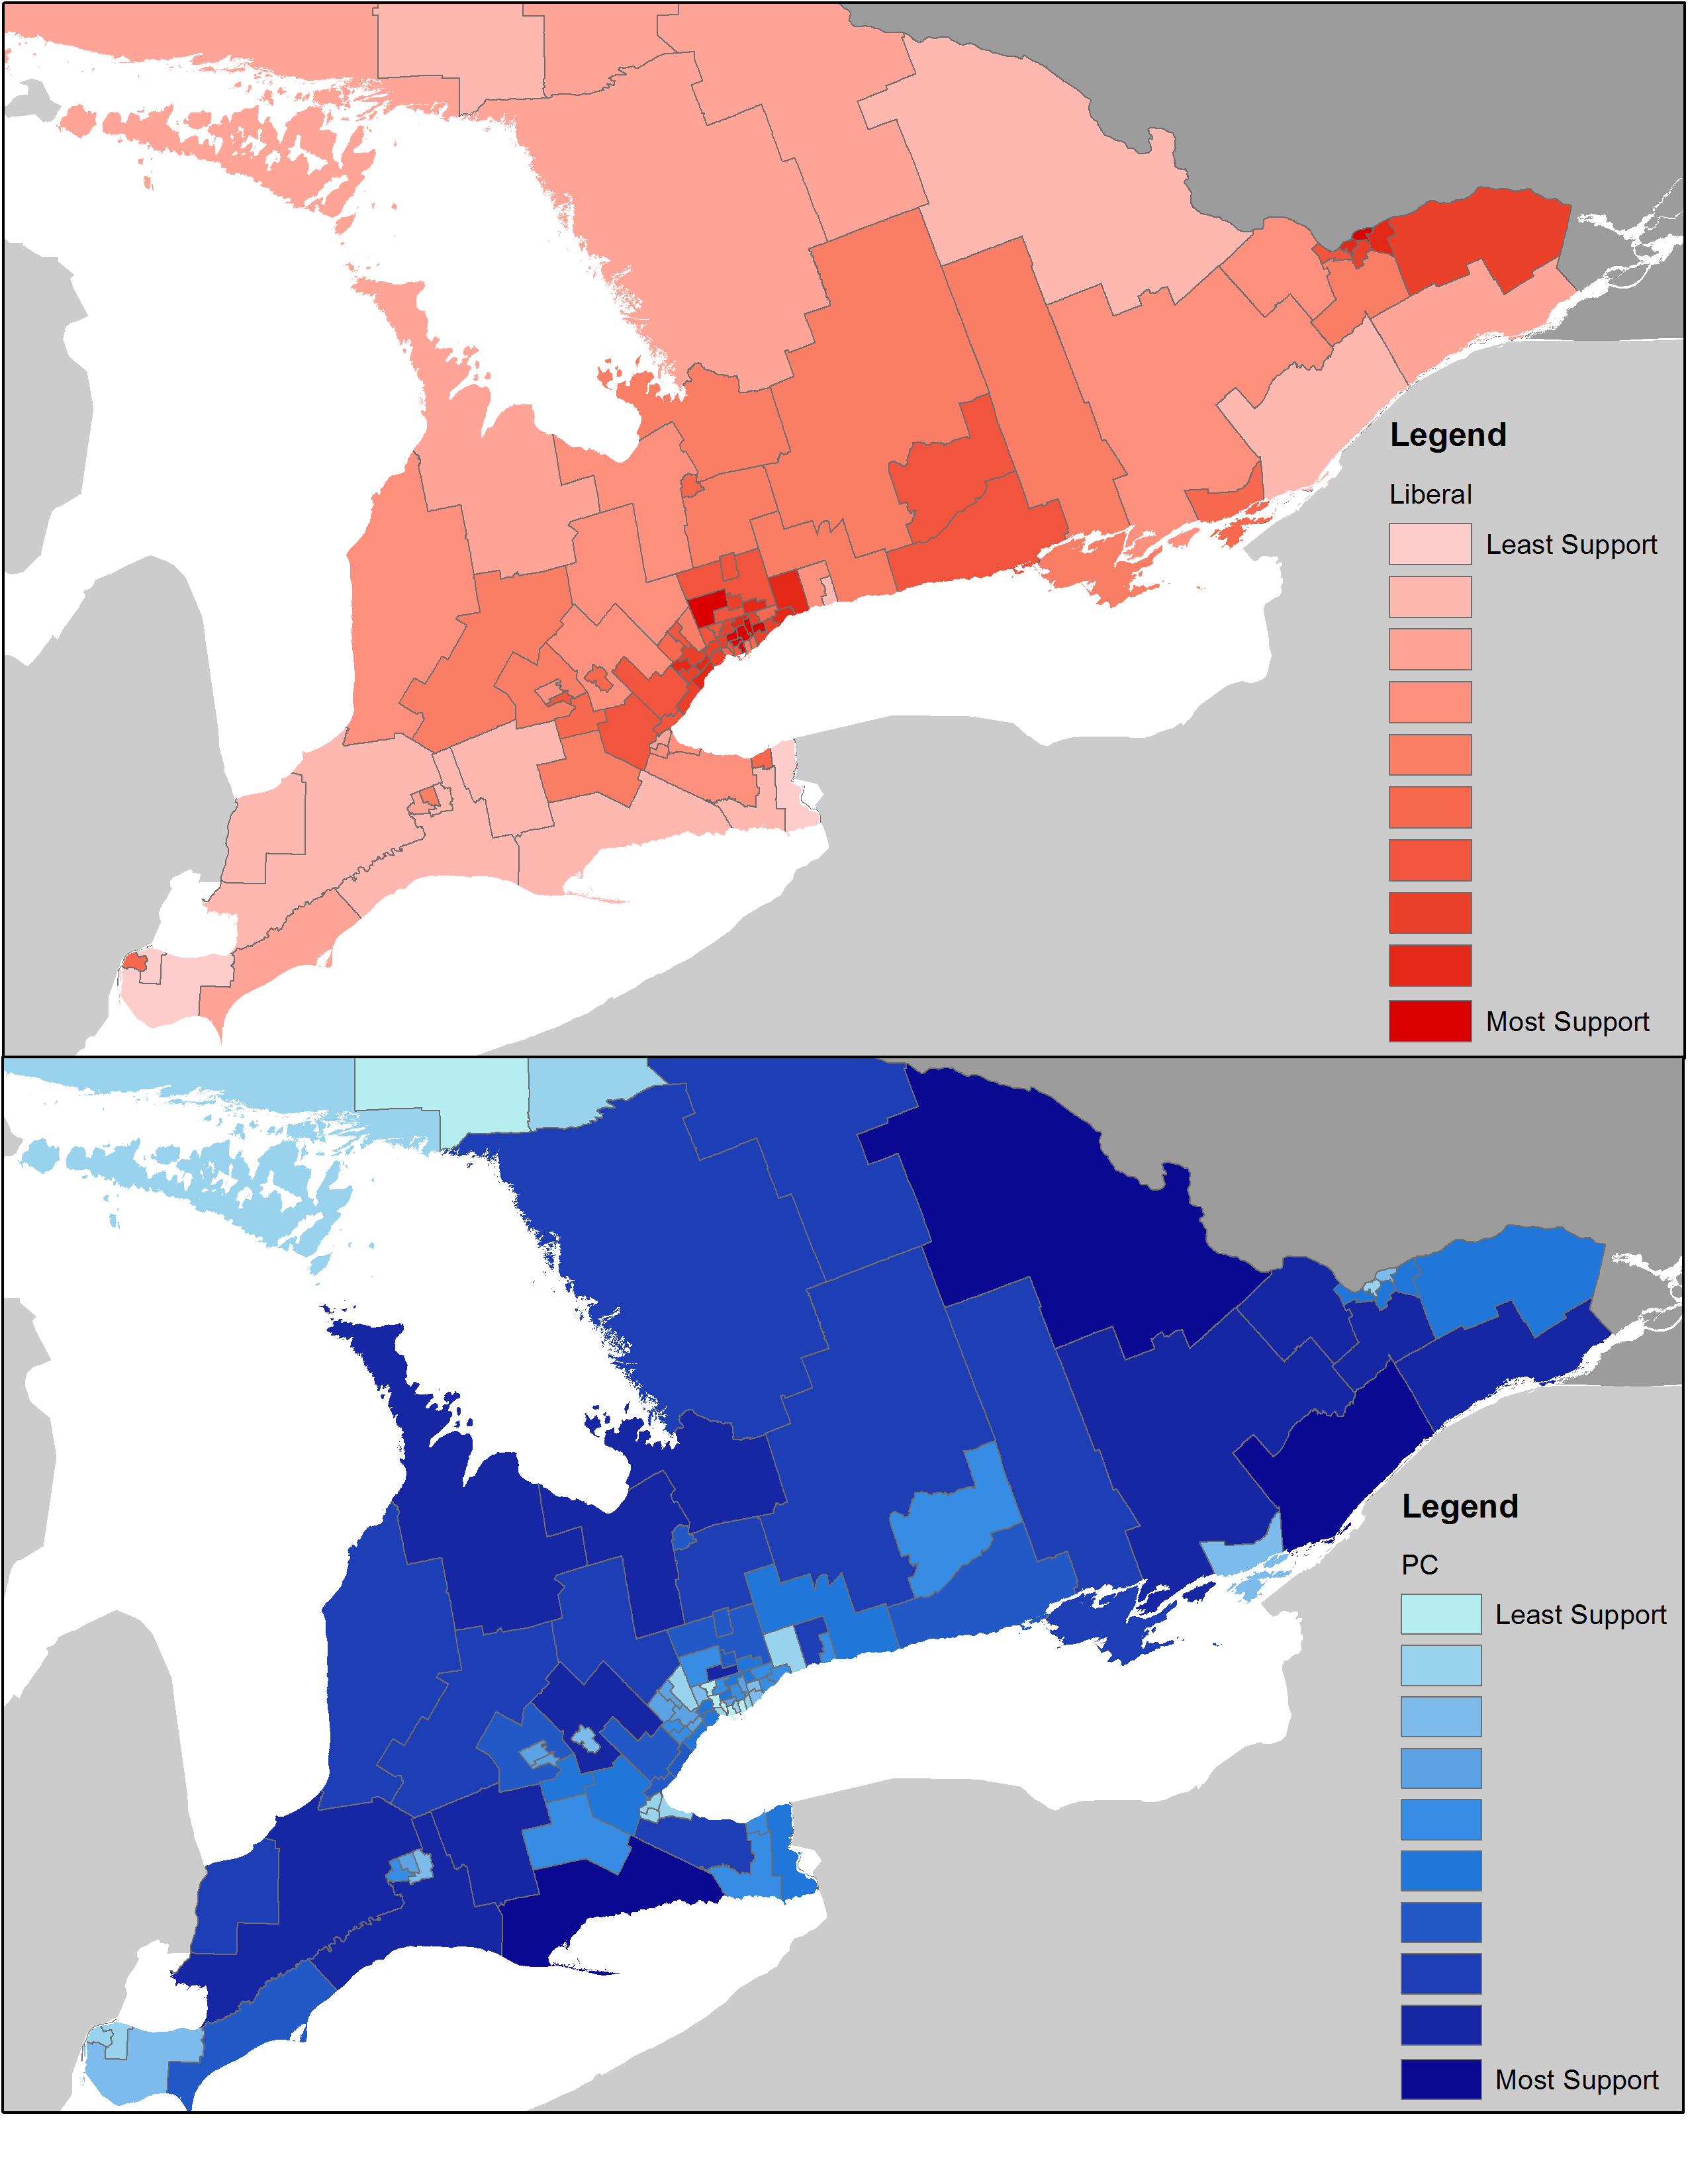
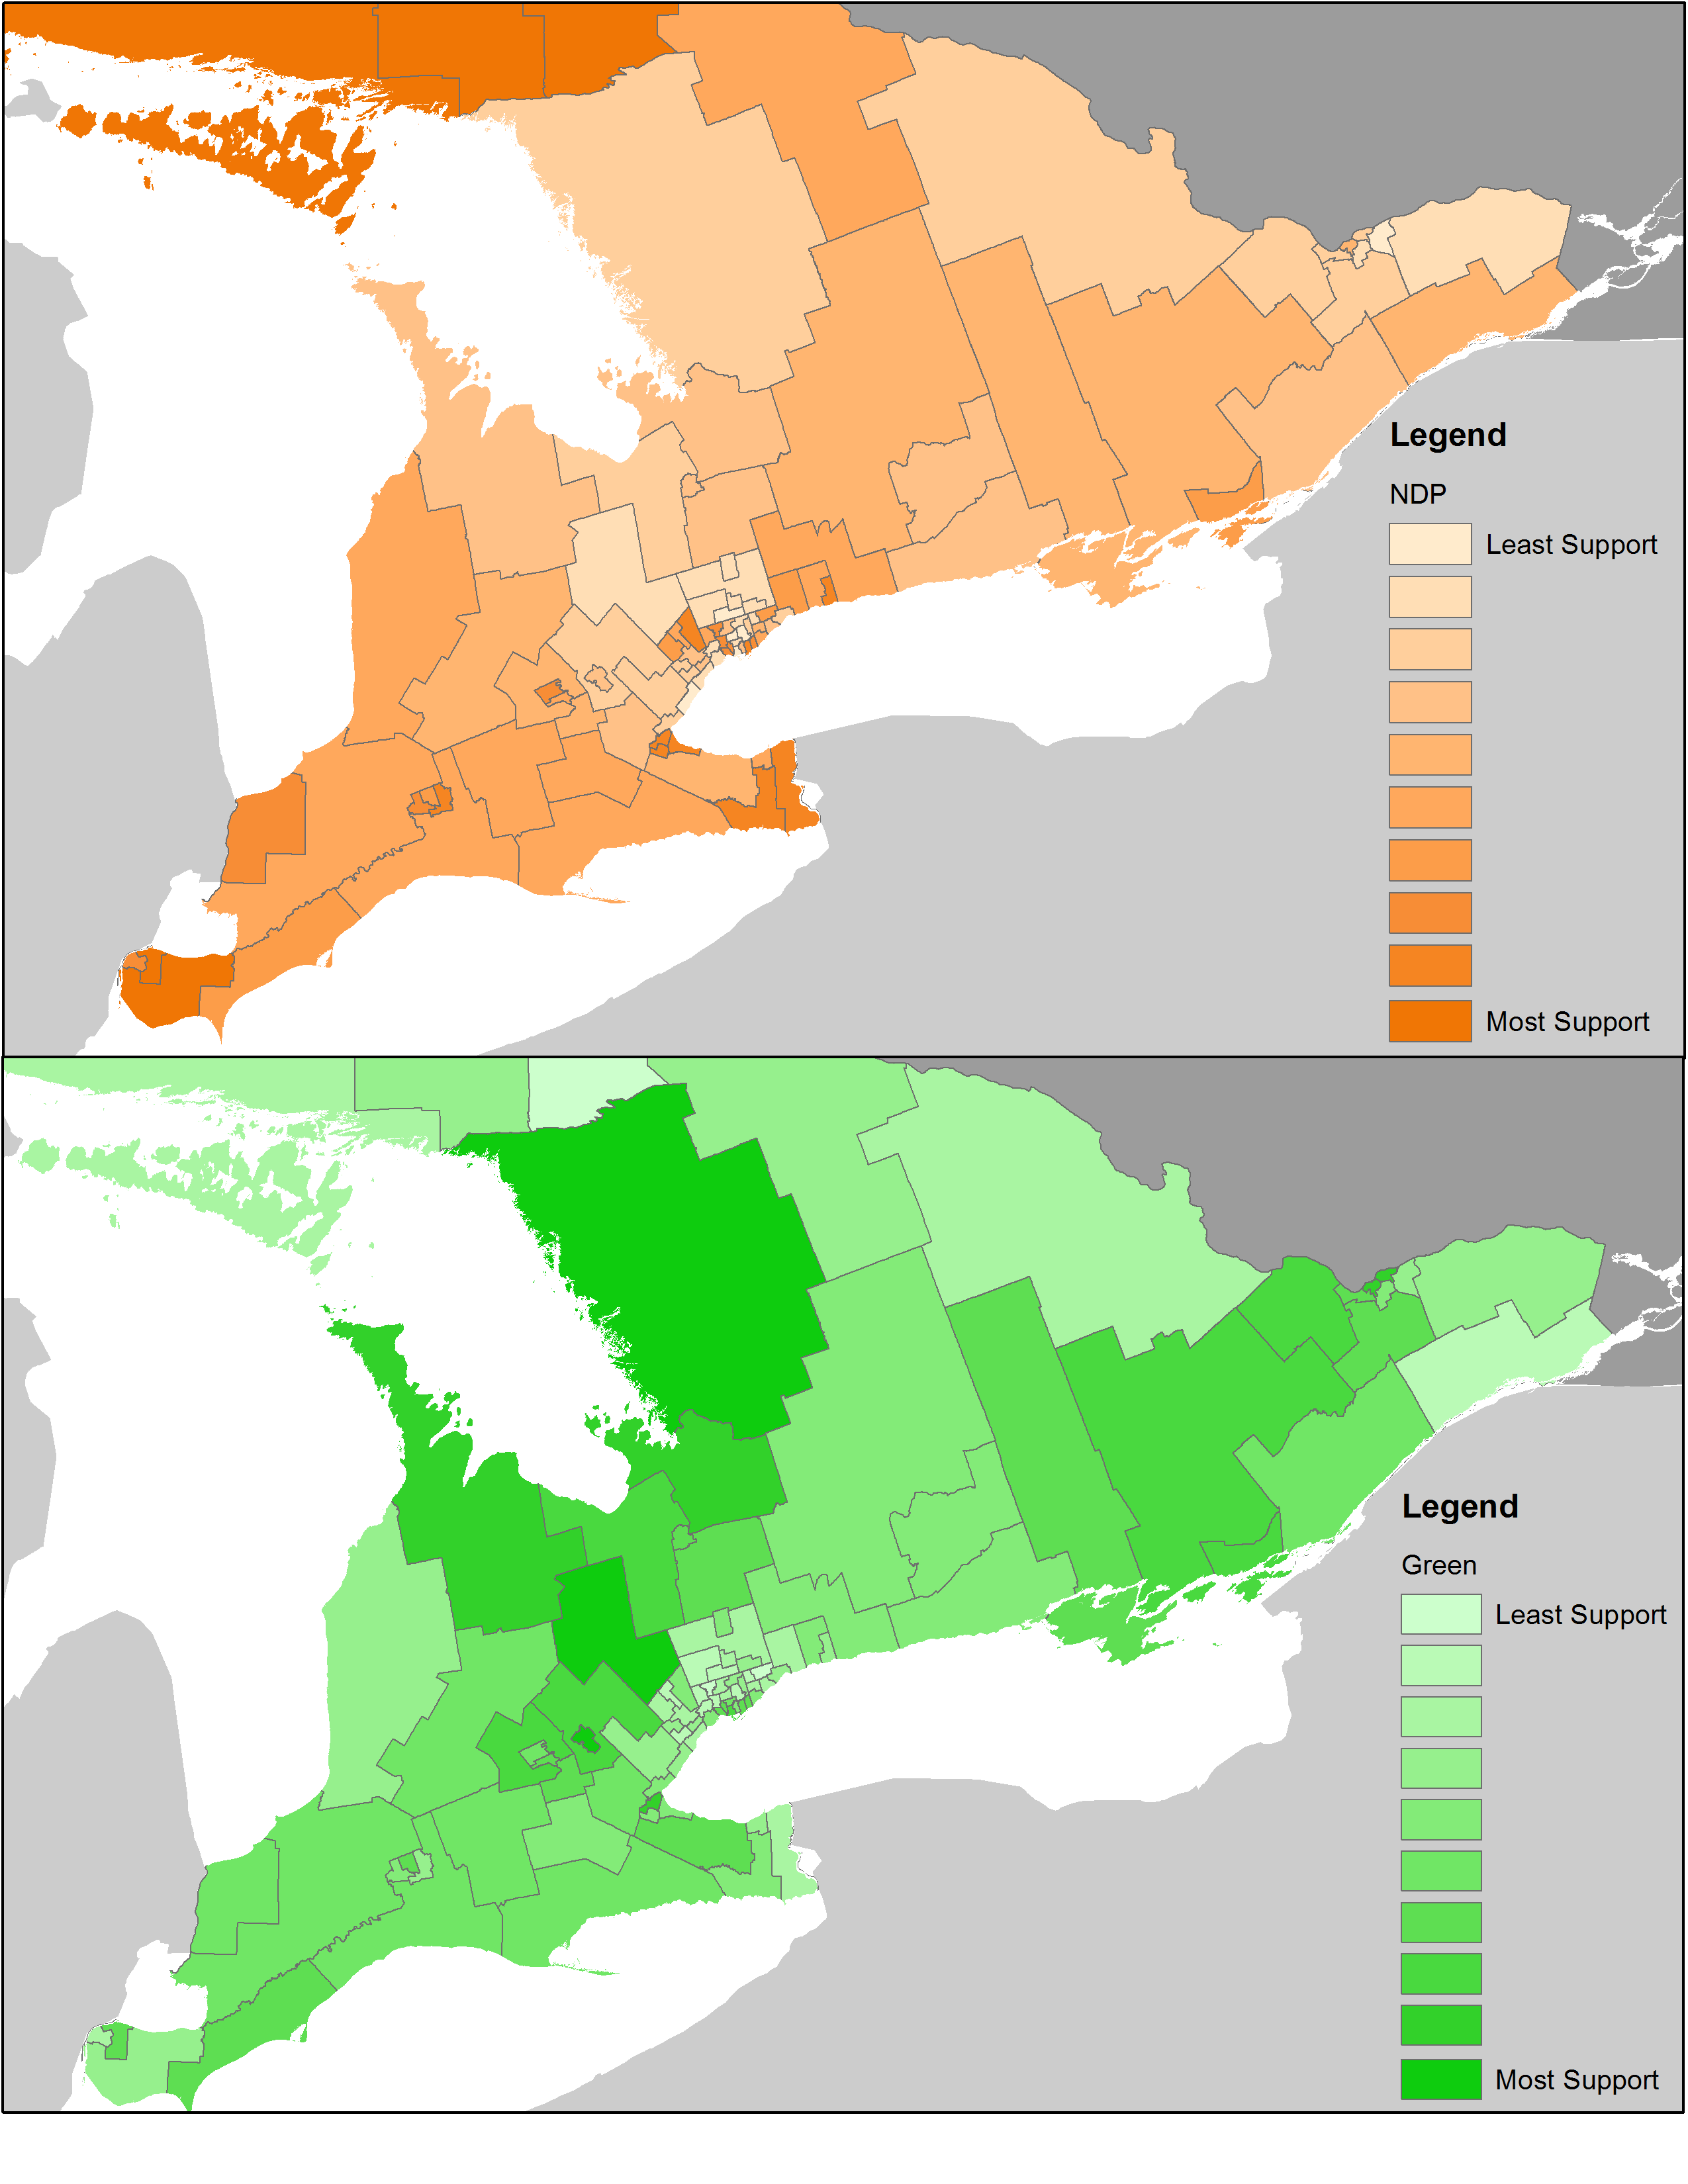
If “all politics are local” and “its about the economy, stupid”, then elections are about economic geography. The Ontario election last week was no exception. The Liberal Party won a surprising majority after a campaign that seemed to suggest a much closer race. In the end, the Liberals won by dominating the urban and suburban areas of the province while the runners-up Progressive Conservatives virtually swept rural Southern Ontario. In my post last week I offered my take on this pattern. This week I have prepared a 2014 Election Factsheet that outlines these divisions in numbers.
Key Highlights:
- Southern Ontario ridings that voted Liberal and NDP have population densities roughly 10 times greater than those that voted PC
- Liberal ridings are growing almost twice as quickly as PC and NDP ridings
- People living in Liberal ridings are 5 times more likely to take public transit to work than people living in PC ridings (20% versus 4%)
- Less than half (45%) of private dwellings in Liberal ridings are detached houses while in PC ridings three quarters of dwellings are detached houses
- It costs on average over $100,000 more to buy a home in a Liberal riding than a PC or NDP riding
- Nearly a third of households in Liberal ridings spend more than 30% of their incomes on shelter
- Immigrants are three times more prevalent in Liberal ridings than PC ridings
- Liberal support is strongest in the 20 ridings with the highest average incomes
- The Liberals won the ridings with the 7 lowest average incomes (all in Toronto)
- Over a quarter (26%) of workers in Liberal ridings are employed in professional service industries (PC, 17%; NDP, 20%)
- Over a third (35%) of the adult population in Liberal ridings has a university degree (PC, 21%; NDP, 25%
And some more maps…

Pingback: OPINION – Ontario’s Urban Election | Local IDEAs